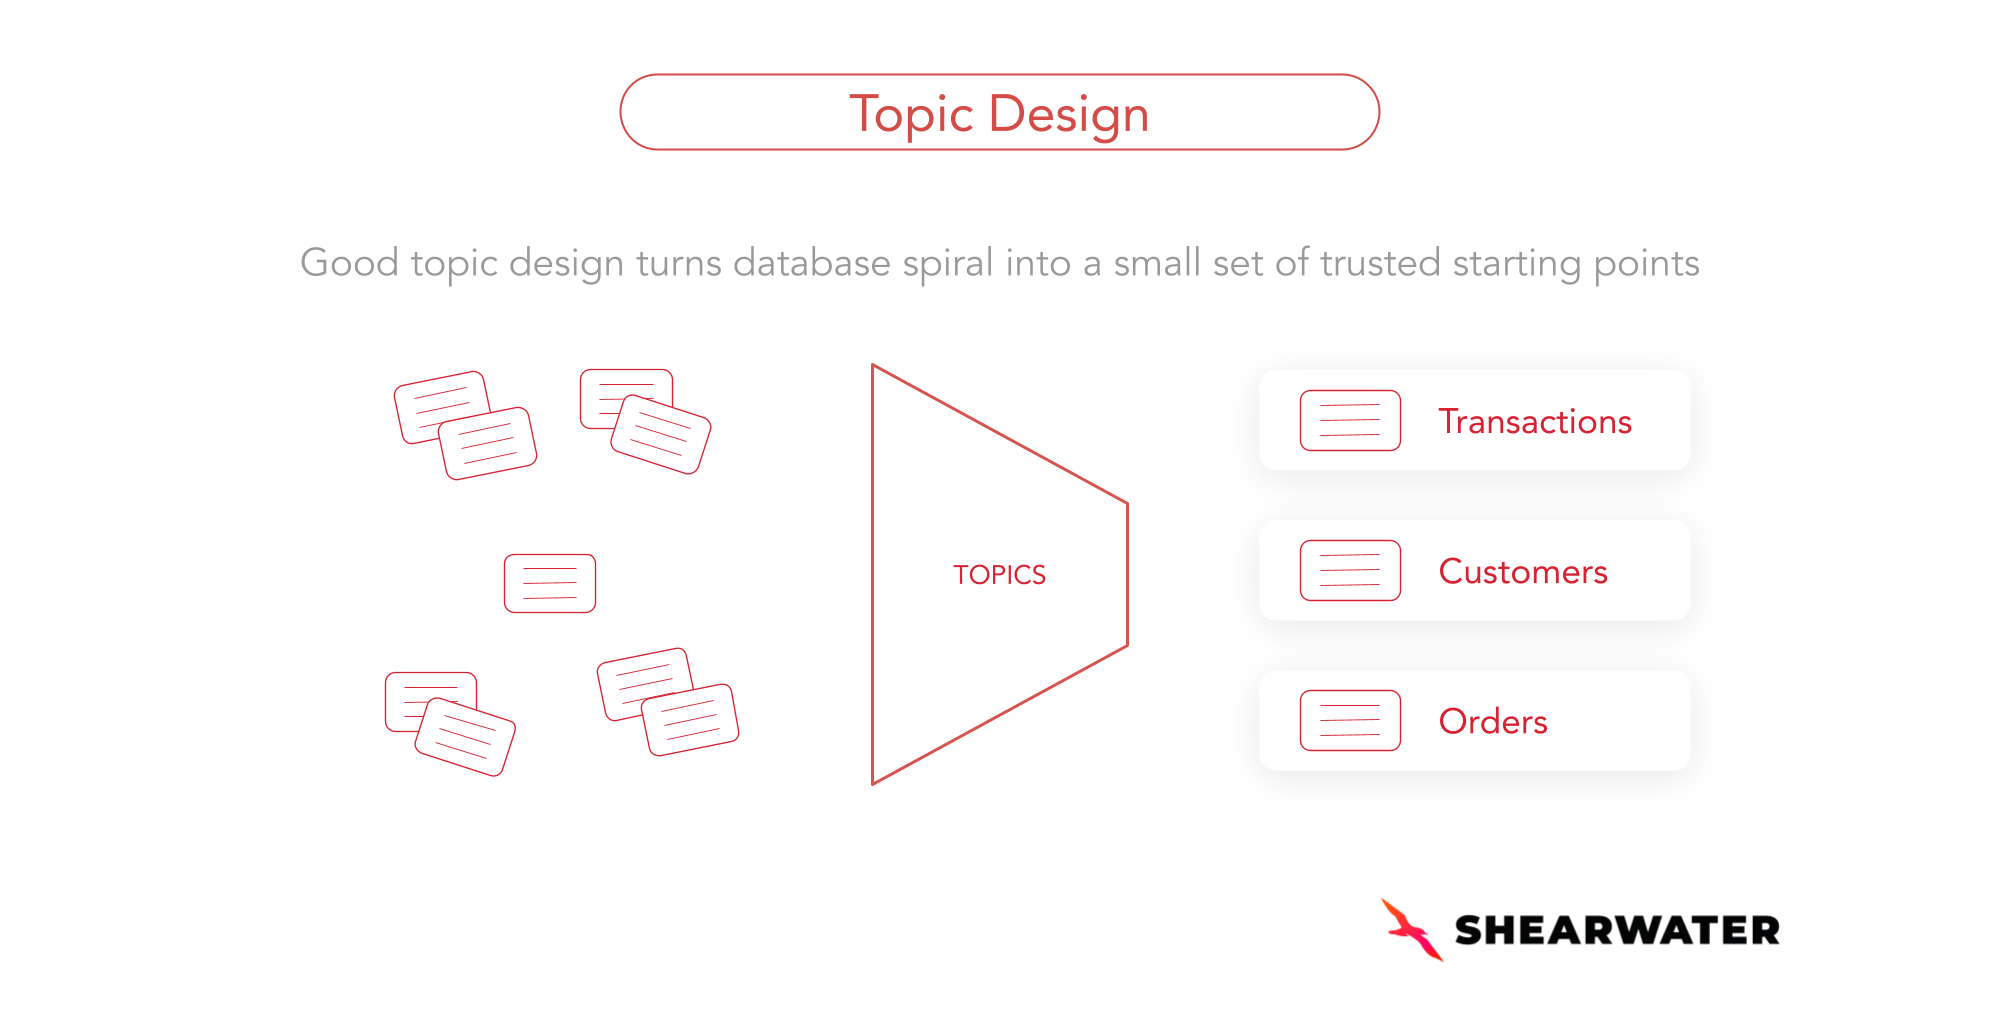


Every analyst who's worked with a semantic layer knows the feeling: you’re assigned to address an existing project and discover hundreds of Topics (or Explores, in Looker terminology), many of them nearly identical, with names that only made sense to the people who created them.
It's the natural result of years of development without clear discipline around what a Topic actually is, who it's for, and when it's worth creating a new one.
As an early Looker employee, I helped scale the platform before its acquisition by Google. I've spent more than two decades in analytics roles at companies like Google and eBay before founding Shearwater Data, and I've seen this pattern play out countless times. It degrades query performance, increases maintenance costs, and frustrates end users.
With that in mind, this article brings together practical principles I've gathered over years of designing semantic models to help you build Topics that are high-performing, easy to understand, and built to scale.
In this article, you'll learn:
- What a Topic actually is
- Why Topics still matter in the age of AI
- Practical rules for structuring Topics
- How to handle derived objects and historical logic
- Patterns for modeling very large fact tables
- What to do when you inherit a broken semantic layer
What a Topic Is Actually For
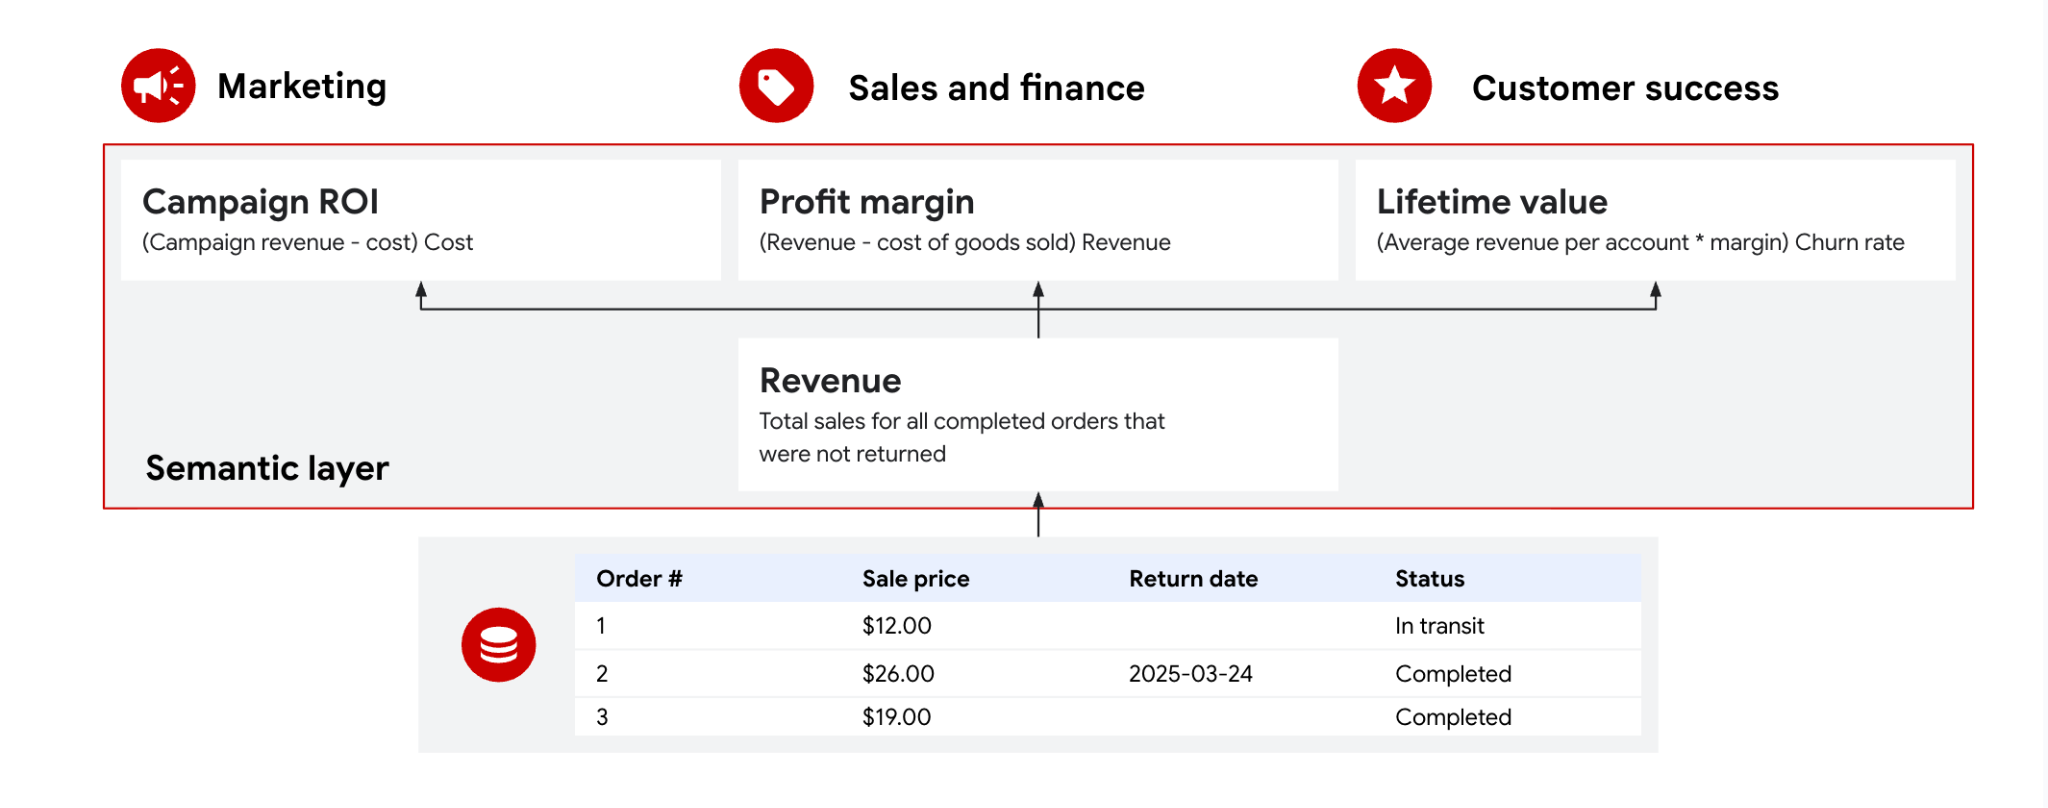
A Topic (or Explore) is a curated starting point for querying data. It defines which tables are joined, which dimensions and measures are available for analysis, and automatically generates the SQL needed to answer business questions. However, the better question is who a Topic is for.
In practice, a Topic exists to hide the complexity of the underlying data model for the benefit of the end user. Users don't need to understand SQL, database schemas, or joins. Instead, they work with familiar business concepts while the semantic layer translates those interactions into accurate SQL queries.
This was one of Looker's most important innovations.
When Lloyd Tabb created Looker, his goal was to enable people who understood the business, but not necessarily SQL or database structures, to answer their own questions through self-service analytics. Rather than exposing the data warehouse directly, the semantic layer provides a governed, business-friendly interface that automatically generates reliable SQL.
Topics Still Matter in the Age of AI
Even with the rise of generative AI, Topics remain just as relevant today, maybe even more so.
While large language models (LLMs) can translate natural language into SQL, leading many to view them as the next generation of self-service analytics, Topics (or Explores) solve a fundamental problem that AI alone cannot. They limit the exploration surface to a known, trusted, and governed set of data. In other words, they define the boundaries within which AI can reason safely.
The quality of AI-generated answers depends entirely on the semantic context surrounding them.
Shearwater Tip: Without trusted metric definitions, consistent joins, carefully modeled relationships, and well-designed Topics, AI will just produce incorrect answers faster. The semantic layer remains the foundation; AI is simply a more intuitive interface for interacting with it.
Topics also provide practical benefits beyond trust and governance. They improve query performance, reduce unnecessary token consumption, accelerate analytical workflows significantly lowering the cost of AI-powered data exploration.
Ultimately, Topic design is one of the biggest factors determining whether a semantic layer becomes a trusted self-service platform or gradually turns into a confusing collection of overlapping datasets for end users.
With that in mind, here are the principles I've found most effective for designing better Topics and Explores that remain intuitive, scalable, and AI-ready.
Five Practical Rules of Thumb
Rule 1: Start With Fact Tables
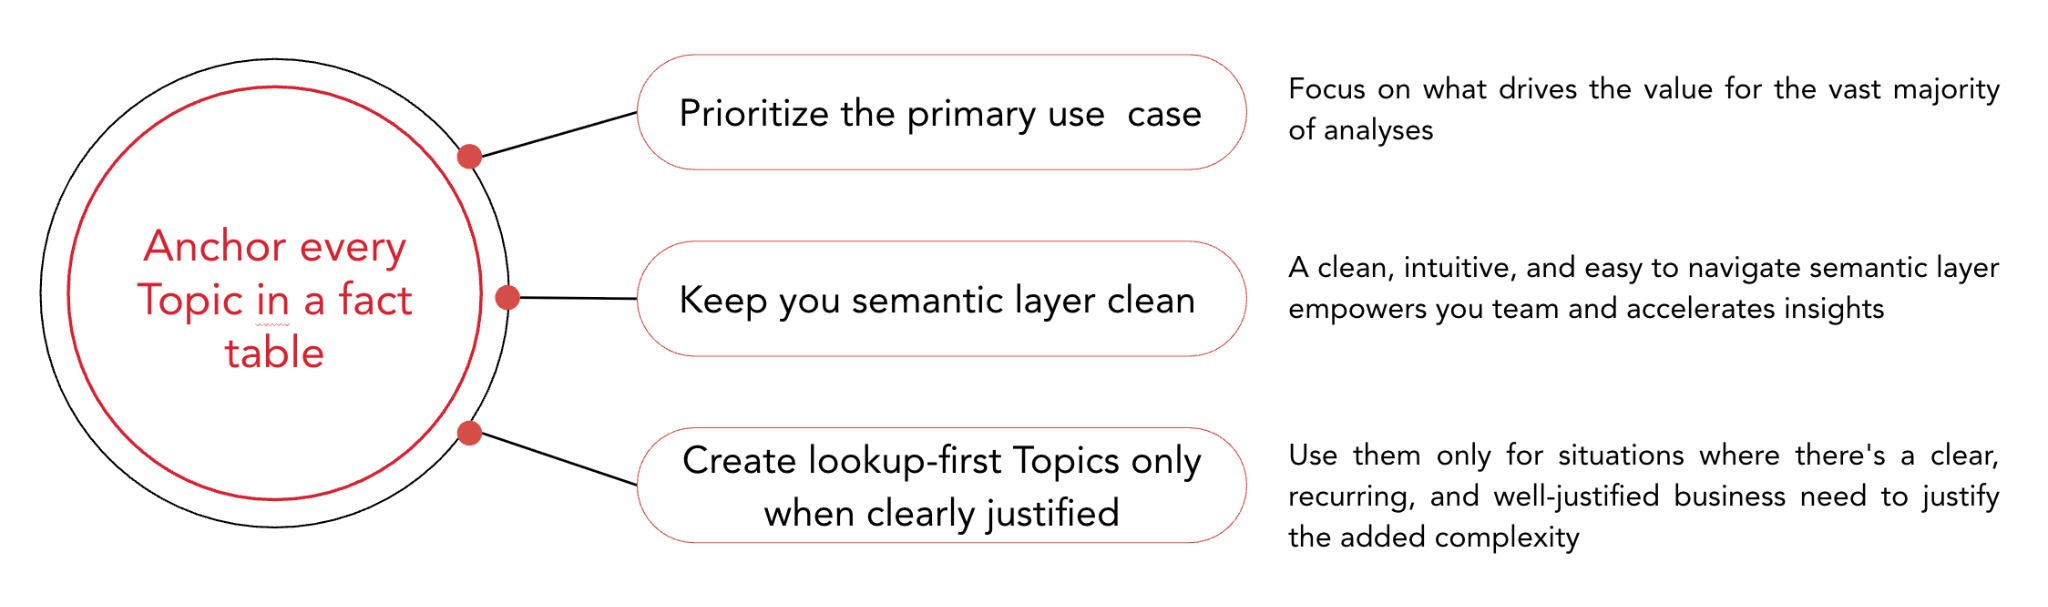
Try to anchor every Topic in a fact table (e.g., transactions, orders, events, or invoices). Think of Fact Tables as first class data objects when designing Topics. They are granular, high-volume tables that represent measurable business activity and naturally support aggregation and analysis.
Lookup or dimension tables (such as users, products, or countries) should rarely serve as your starting point because they typically don't contain the primary quantitative metrics that users want to analyze. In addition, Dimension tables are usually already available through other fact-based Topics, making standalone dimension Topics unnecessary in most cases.
Starting a model from a dimension table and joining fact tables can create redundancy and cause confusion for end users.
For example, imagine both a Customers Topic and a Transactions Topic expose customer transaction data. Which one should someone use to analyze revenue by customer? The answer shouldn't depend on the user's familiarity with the semantic model. Questions like this increase cognitive load, fragment the semantic layer, and ultimately reduce trust in the model.
Preserving Cardinality with LEFT JOINs
In practice, good Topic design means making the fact table your base view and attaching lookup dimensions using LEFT JOINs. This pattern is the backbone of semantic layer modeling for a simple reason: it preserves the natural cardinality of the underlying event. Each joined dimension table simply enriches the event without changing its grain or inflating the row count.
Resist Topic Proliferation for Edge Cases
When a stakeholder asks for a "Users" Topic, it's almost always worth digging deeper. Nine times out of ten, what they actually need is a Transactions Topic with user attributes joined in, not a standalone Users Topic.
An inevitable pushback is a common edge case with join direction: "What if I need to count users who have never made a transaction?"
Technically, they have a point. If you start with the transactions table and LEFT JOIN users, non-transacting users are excluded from the result. To include them, you'd need to make users the base view and LEFT JOIN transactions instead. That returns every user, but it no longer represents every transaction independently. In this case an OUTER JOIN can be used in your Topic but it should be an exception as OUTER JOINs can be expensive.
Designing a semantic layer around edge cases is what leads to Topic bloat. Instead of navigating a small set of intuitive entry points (like fact tables), users are forced to choose between dozens of nearly identical Topics whose differences they rarely understand.
Rule 2: Fewer Topics Is Better
Creating a new Topic for every new business question may feel practical in the short term, but it ultimately creates the very problem a semantic layer is meant to solve: an interface crowded with similar-looking entry points and no clear guidance on where users should begin.
Every additional or redundant Topic increases users' cognitive load and creates another opportunity for users to start in the wrong place and arrive at misleading conclusions.
Shearwater Tip: Good semantic modeling isn't about exposing every possible path through the warehouse. It's about designing the smallest possible set of intuitive entry points that answer the largest number of business questions.
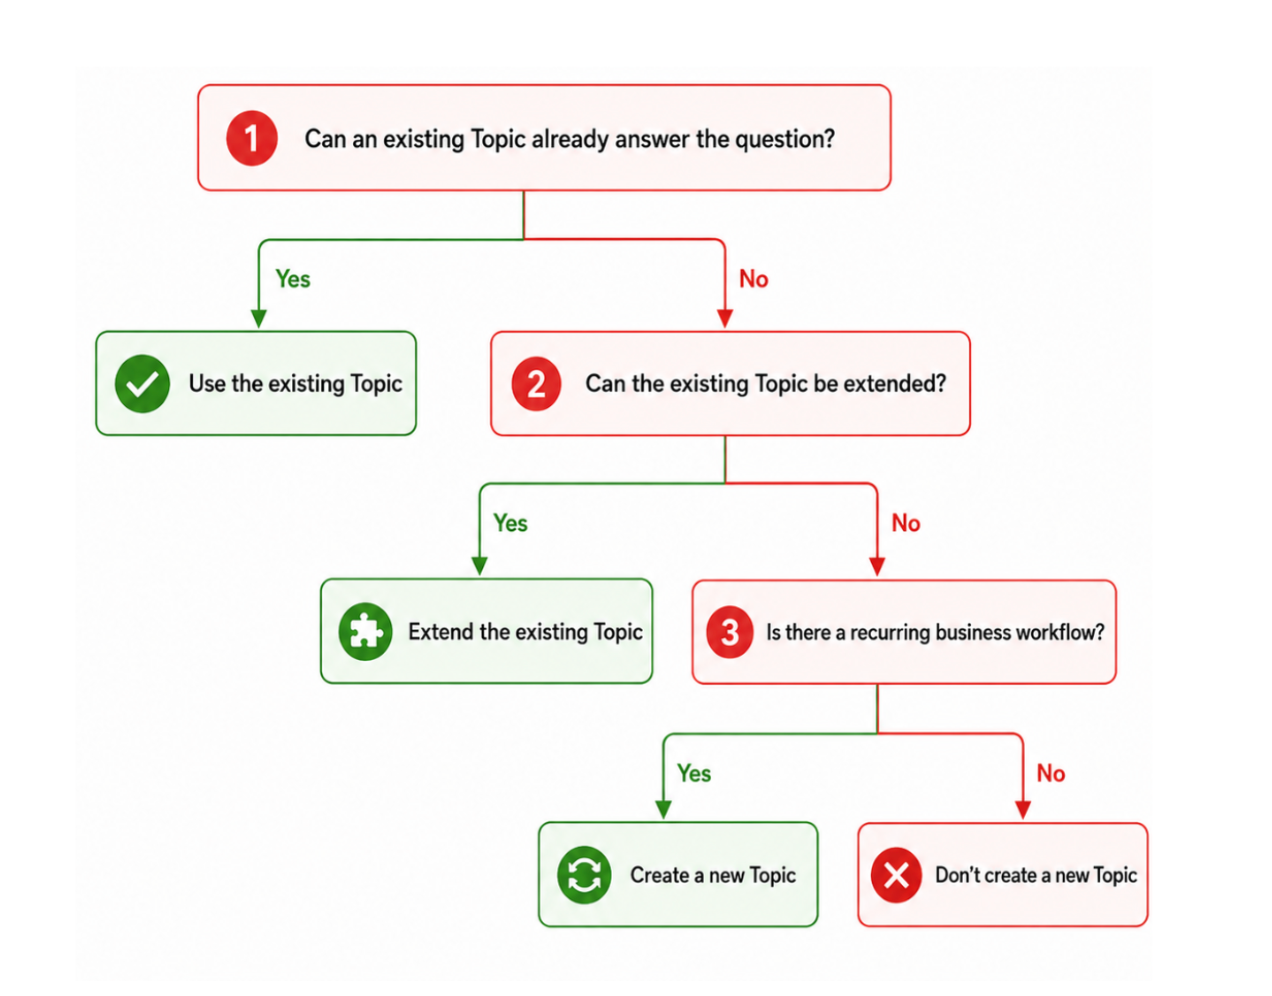
Before creating a new Topic, ask three questions:
- Can an existing Topic already answer the question?
- If not, can the existing Topic be embellished?
- If neither is possible, does the new use case truly justify a new entry point?
A common mistake is ending up with three Topics where two would have been enough. For example, creating separate Topics for Invoices and Transactions, then introducing a third Topic whose only purpose is to connect them. In many cases, that relationship can simply be incorporated into one of the existing Topics.
Topic design should be driven by the primary business entity, or grain, that users are analyzing. A Transactions Topic is designed to analyze transactions and an Invoice Topic is designed to analyze Invoices.
That doesn't automatically mean both should exist. If the organization rarely analyzes invoices independently from transactions, a separate Invoice Topic may create more confusion than value. In many cases, it's better to keep a single Transactions Topic and introduce a dedicated Invoice Topic only when there's a genuine, recurring business need for user-centric analysis.
Rule 3: Minimal Overlap Between Facts
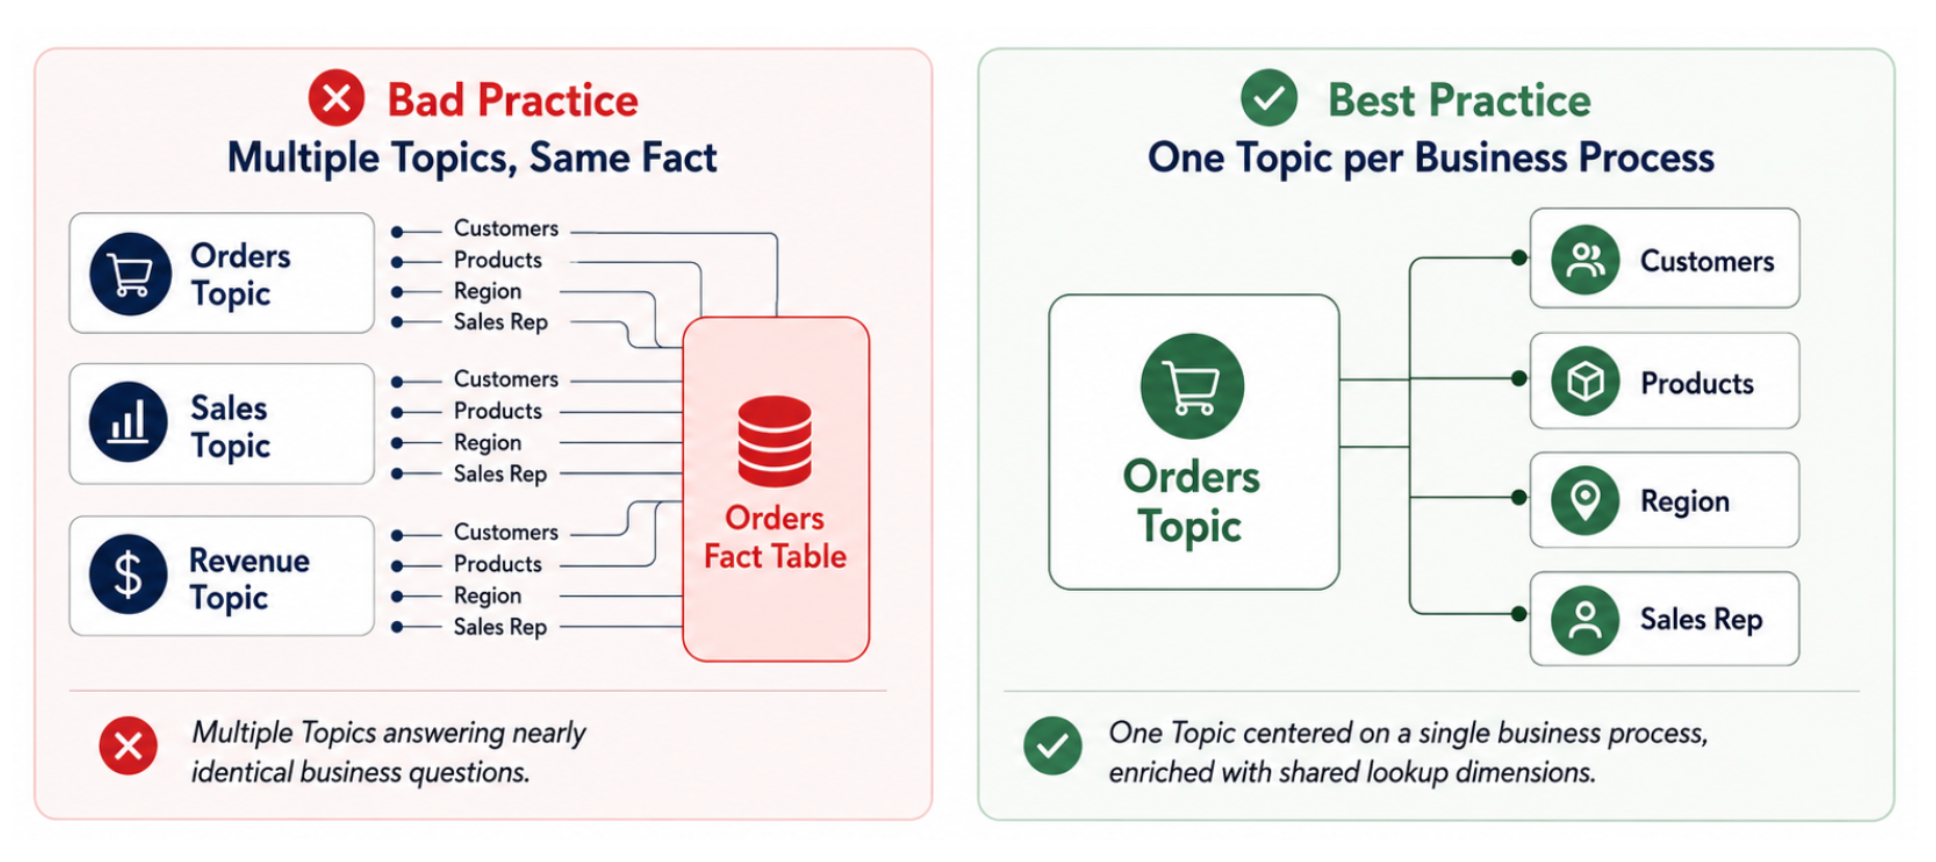
Some duplication is both expected and desirable. Lookup entities such as Users, Products, or Regions will naturally appear across multiple Topics because they provide context for many different business processes.
The duplication you should avoid is exposing the same fact table across multiple Topics that answer nearly identical business questions.
Understanding Overlap: Dimensions vs. Facts
A common point of confusion when keeping models lean is understanding schema overlap:
- Dimension/Lookup Overlap is Normal: A core lookup table like users or products will naturally be joined into almost every fact Topic you build. This is healthy and expected.
- Fact Overlap Creates Technical Debt: What you must avoid is taking the same fact table and anchoring it across multiple, slightly different Topics.
Rule 4: Don't Build What You Don't Need Yet
Building Topics is very easy; refactoring or deprecating them later is hard.
Changes to a semantic model carry downstream risks that are outside the scope of the semantic model. Altering or deleting a Topic can unknowingly break reporting, dashboards and schedules.
Also, you might discover the ideal design for a Topic only after getting feedback on what users expected.
Resist the urge to model your entire warehouse upfront. It's tempting to create Topics proactively because we feel they might be useful. However, it's best to start by building a clean foundation on what is used, observe how people actually work with the data, and evolve your semantic layer based on reporting requests and real business workflows. It takes moments to fashion a topic but hours correcting broken reports.
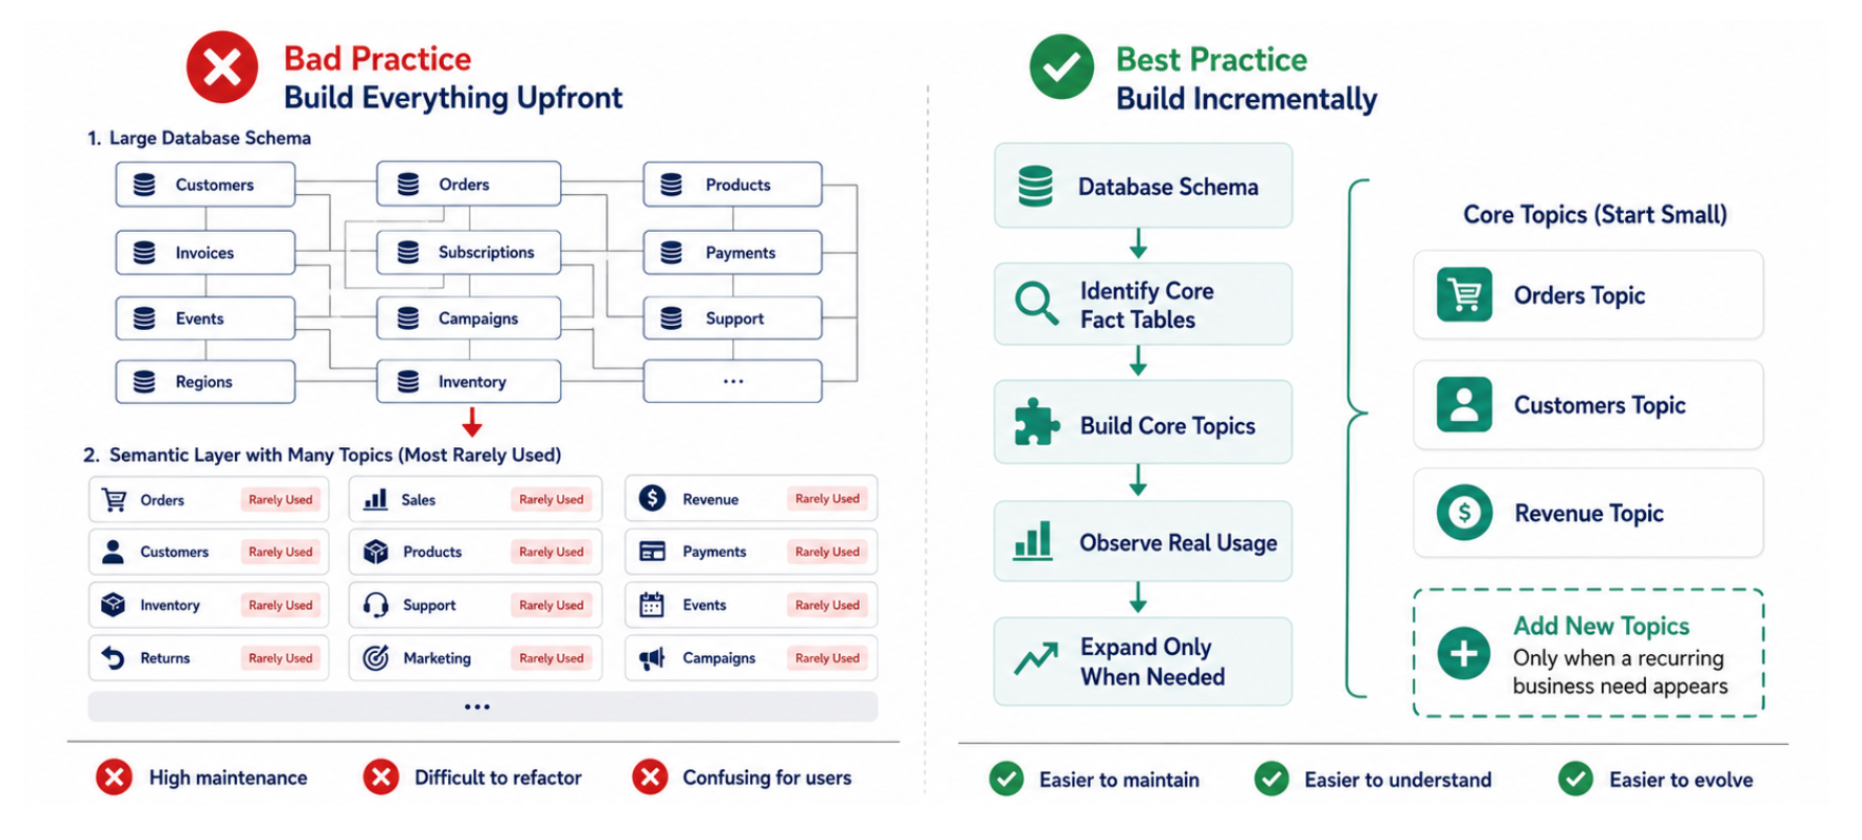
Build from the Core Outward
Instead of attempting full schema coverage from day one, identify your core fact tables (the primary drivers of business activity) and build Topics around them first. Develop incrementally based on real analytical demands rather than theoretical scenarios. By keeping your initial semantic surface area small, you reduce noise for end-users and avoid the painful process of cleanup down the road.
Shearwater Tip: If a Topic doesn't solve a real business need today, don't build it yet. Ultimately, the analyses people are trying to perform, not the database schema itself, should determine what a Topic becomes.
Rule 5: Topics Aren't Built For The People Who Create Them
Topics aren't built for the people who create them. They're built for the people who use them.
Naming is just as important as modeling. Good Topic design requires empathy.
Before a user even opens a Topic, its name should answer a simple question: "What business process does this help me analyze?"
Names like Transactions, Orders, Customers, or Subscriptions answer that question immediately. Internal project names, team jargon, or clever technical references rarely do.
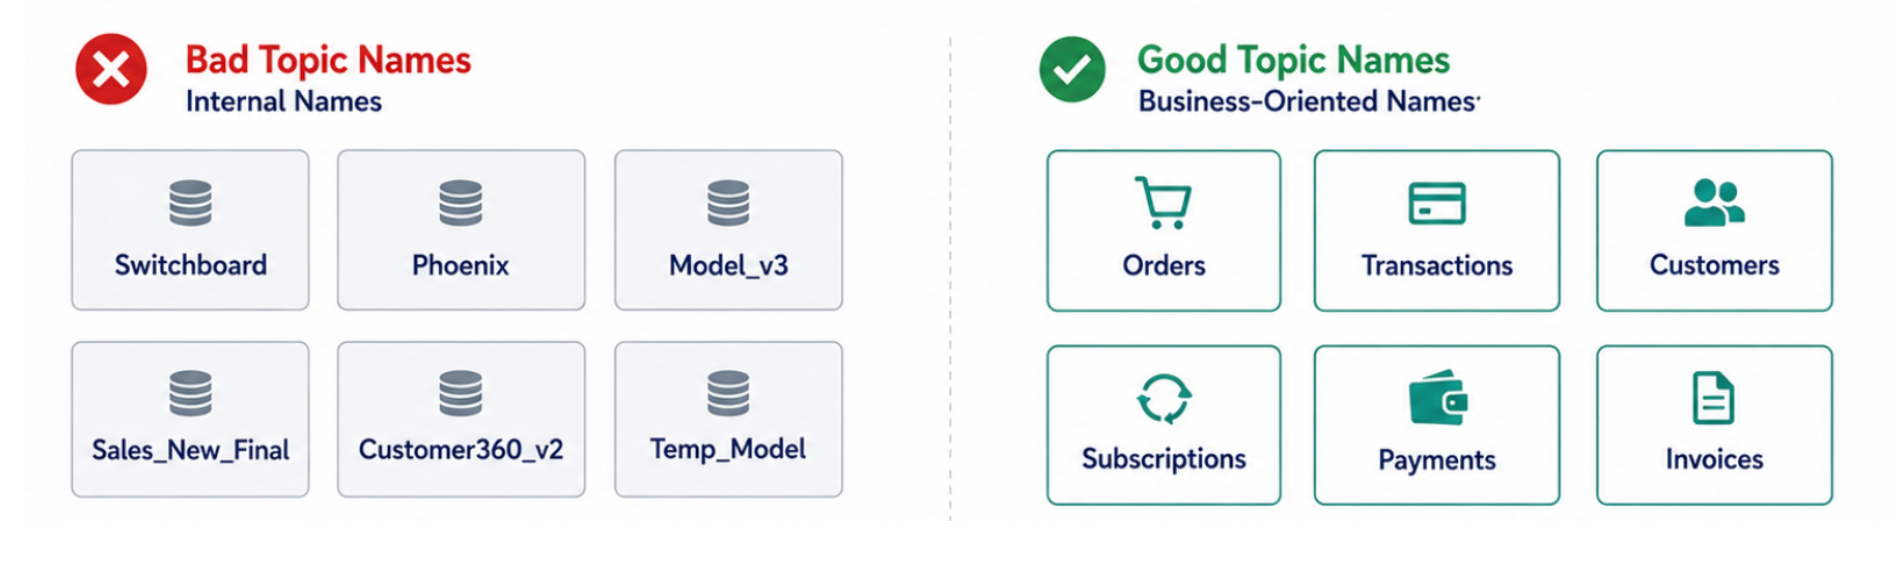
One of the easiest mistakes to make is naming a Topic after an internal project, a team nickname, or a technical concept that only its creator understands. I once came across an Explore called "Switchboard." Its creator knew exactly what it did, it was an impressive model combining several datasets, but everyone else ignored it because they had no idea what "Switchboard" represented or when they were supposed to use it.
Derived Objects: Storing Logic That Can't Run on the Fly
Beyond core Topics, another important design decision involves query views (historically called “derived tables”,"user facts" or calculated tables). These objects solve a specific problem: metrics that cannot be calculated dynamically at query time without losing historical context.
An example is a user's Lifetime Value (LTV) or First Order Date. If you filter a transaction Topic to the "last 3 months," calculating a user's first order on the fly will incorrectly return the first order within that window, completely missing their true historical first purchase.
Isolate, Don't Scatter
To prevent this, isolate entity-level logic into a single derived object (e.g., user_facts). Never let multiple developers recreate slightly different variations of user facts across the project. Whenever a stakeholder needs historical user attributes, join this single source of truth to the transaction table.
When Derived Tables are Mandatory
While you should minimize complex SQL inside your semantic model, two technical scenarios make derived tables unavoidable:
- Unions (UNION / UNION ALL): BI tools natively struggle with unions. However, needing a union is often indicating that data should have been consolidated upstream in the data warehouse (e.g., via dbt).
- Re-aggregated Window Functions: Simple running totals or lead/lag operations can often be handled natively in modern BI tools (like Omni or Looker) at the visualization layer. However, if you need to execute a window function and then aggregate the result of that window function, it must be isolated in a derived table.
Push Business Logic Downstream
Whenever possible, push calculations as far downstream as performance allows.
BI Measures/Dimensions > Derived Tables > ETL / Data Warehouse
In semantic layer BI tools, prefer declaring a metric over a derived table, and a derived table over locking logic deep inside your ETL. Keeping calculations downstream maximizes visibility, auditability, and flexibility.
Big Data: Balancing Speed, Cost, and Architecture
When a fact table grows to billions of rows (e.g., Google Analytics event streams), querying raw events can take hours not minutes. In big data scenarios, every query threatens to stall dashboards or rack up massive warehouse costs.
To navigate this without abandoning solid modeling principles, try to leverage these three key mechanisms before aggregating metrics upstream:
- Templated Filters: Instead of querying full history and filtering results post-execution, inject user-selected dashboard variables directly into the SQL query of the derived table. This limits data scanning to only what is strictly necessary.
- Default ("Soft") vs. Always-Where ("Hard") Filters: Use default filters to guide users toward performant time ranges (e.g., defaulting to the last 30 days) while allowing adjustments. Use "hard" SQL filters behind the scenes for mandatory security constraints (e.g., domain-level data isolation).
- bind_all_filters: A powerful feature in modern tools like Omni (and Looker). If you join a user_facts object into a transactions Topic filtered for "last 2 months," bind_all_filters automatically inherits and pushes that 2-month constraint down into the derived object SQL. This avoids scanning 20 years of historical user data without needing manual CTE adjustments.
A Less Obvious Pattern: Right Joining a Calendar Spine
For stateful data like CRM opportunities (where the main table only reflects current status and historical state changes live in an audit log), turning status periods into daily snapshots can be tricky.
An elegant pattern is creating a historical state object and performing a RIGHT JOIN against a Calendar Spine. Because modern BI tools construct SQL dynamically, this join is only triggered when a user explicitly requests a historical trend over time, leaving current-state queries unaffected and lightweight.
The Uncomfortable Reality: Inheriting a Broken Model
Not every project begins with a clean slate. Data teams frequently inherit semantic models where years of ad-hoc DBT modeling have left dozens of pre-aggregated, undocumented tables.
In conversations with people who were close to Looker's earliest days, I've heard the same answer come up when the question is “how to fix a deeply corrupted semantic layer”: start over. Rebuilding from scratch is always easier than correcting bad modeling foundations. Slowly migrating users to a new semantic model allows us the ability to indirectly prune old content by migrating only what is requested.
Conclusion
Topic design is more art than science, but it isn't arbitrary. Excellent Topic design isn't about exposing database tables; it's about reducing complexity.
The best semantic layers do not try to cater to every theoretical edge case. Instead, they provide a curated set of intuitive entry points aligned with business processes, not database schemas. When Topics are built with discipline:
- Users ask fewer questions and find answers faster
- Metrics stay consistent across the enterprise
- AI agents generate significantly more accurate, reliable results
- Self-service analytics finally lives up to its promise